By the Numbers
Measuring our progress holds us accountable.
Our goal is to make sure we are not only on the right track but keeping a proper pace.
Overview
Dominion Energy reports workforce representation numbers in accordance with federal reporting categories, but we define success more broadly. Among other achievements in 2022, we increased diverse workforce representation by 1.5 percentage points.
While we do not include demographic groups beyond those reported to the U.S. Department of Labor in our reported diversity metrics, we consider them important contributors to our company’s overall DE&I efforts. Individuals with different experiences bring unique perspectives to the table, broadening how we look at the world and improving our understanding of how we can be of service to others. In 2022, veterans made up more than 18% of all hires, and veterans currently make up 17% of our workforce.
As required by the Equal Employment Opportunity Commission (EEOC), our EEO –1 Component 1 data does not include an “undeclared” demographic status. Those employees who have chosen an “undeclared” status have been placed in a demographic category in accordance with the EEOC guidance applicable to our EEO –1 Component 1 reporting.
We are intentional in our talent sourcing efforts to increase the likelihood that applicant pools reflect the communities in which we serve. The improvements in our diverse hiring in recent years are a direct result of the outreach, and other efforts, to recruit the brightest and most diverse pools of candidates possible. Certain changes in the business structure, such as the 2022 sale of our natural gas distribution business in West Virginia, can also impact diverse workforce representation.
As a large organization subject to regulation by the Office of Federal Contract Compliance Programs (OFCCP), Dominion Energy annually submits an EEO –1 Component 1 Form. The company publicly discloses EEO –1 data on its workforce demographics by race/ethnicity and gender.
As of the publication of this report, the EEOC has not yet released the 2022 EEO –1 Component 1 Form. We plan to disclose our 2022 EEO –1 data on our website once the EEOC makes the form available.
Workforce Representation1
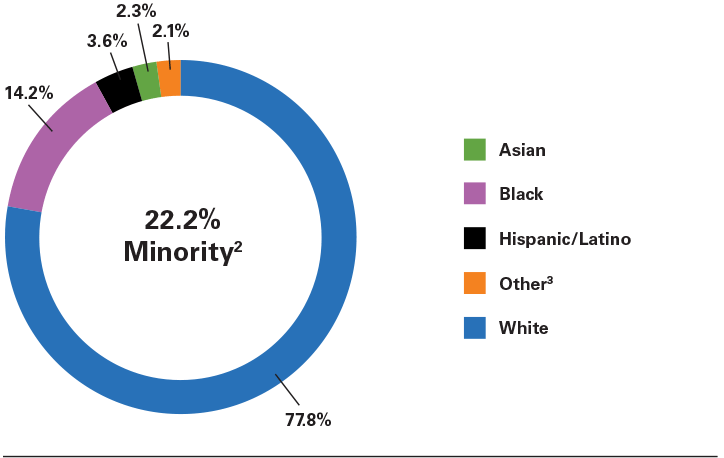
Total Workforce Representation
by Race/Ethnicity
Percent

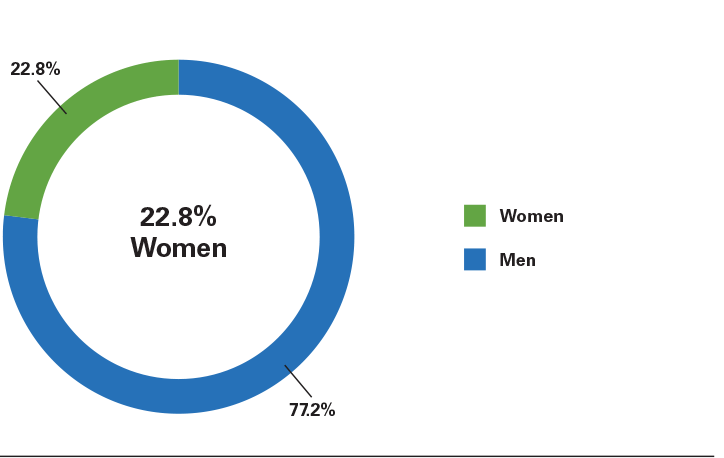
Total Workforce Representation
by Gender
Percent

| Race | Gender | 2021 (17,387 Employees) | 2022 (17,211 Employees) | Labor Market Availability4 (Local) | People Living in our Communities 5 (26 Million People) |
|---|---|---|---|---|---|
| Asian | Women | 0.8% | 0.8% | 1.9% | 2.4% |
| Men | 1.4% | 1.5% | 3.4% | 2.1% | |
| Black | Women | 5.3% | 5.6% | 7.5% | 10.0% |
| Men | 8.2% | 8.6% | 11.1% | 8.9% | |
| Hispanic/Latino | Women | 0.9% | 1.0% | 2.1% | 4.3% |
| Men | 2.2% | 2.6% | 7.2% | 4.6% | |
| Other3 | Women | 0.5% | 0.6% | 0.8% | 1.5% |
| Men | 1.4% | 1.5% | 1.6% | 1.4% | |
| White | Women | 14.8% | 14.8% | 19.9% | 32.8% |
| Men | 64.5% | 63.0% | 44.5% | 32.0% | |
| Diverse Total | 35.5% | 37.0% | 55.5% | 68.0% | |
Data as of 12/31 of specified year | |||||
| Race | Gender | 2021 (317 Leaders) | 2022 (324 Leaders) | Labor Market Availability4 (National) | People Living in our Communities 5 (26 Million People) |
|---|---|---|---|---|---|
| Asian | Women | 1.2% | 1.2% | 2.3% | 2.4% |
| Men | 1.6% | 1.9% | 4.3% | 2.1% | |
| Black | Women | 5.3% | 5.6% | 3.2% | 10.0% |
| Men | 5.4% | 6.5% | 3.6% | 8.9% | |
| Hispanic/Latino | Women | 0.3% | 0.6% | 3.3% | 4.3% |
| Men | 0.0% | 0.0% | 6.0% | 4.6% | |
| Other3 | Women | 0.0% | 0.0% | 0.9% | 1.5% |
| Men | 0.9% | 0.9% | 1.3% | 1.4% | |
| White | Women | 23.3% | 21.6% | 24.8% | 32.8% |
| Men | 62.3% | 61.7% | 50.3% | 32.0% | |
| Diverse Total | 37.7% | 38.3% | 49.7% | 68.0% | |
Data as of 12/31 of specified year | |||||
| Race | Gender | 2021 (2,273 Leaders) | 2022 (2,221 Leaders) | Labor Market Availability4 (National) | People Living in our Communities 5 (26 Million People) |
|---|---|---|---|---|---|
| Asian | Women | 0.4% | 0.3% | 1.5% | 2.4% |
| Men | 1.1% | 1.1% | 3.0% | 2.1% | |
| Black | Women | 3.3% | 3.8% | 4.9% | 10.0% |
| Men | 6.4% | 6.9% | 6.3% | 8.9% | |
| Hispanic/Latino | Women | 0.5% | 0.3% | 1.6% | 4.3% |
| Men | 1.7% | 1.7% | 4.2% | 4.6% | |
| Other3 | Women | 0.2% | 0.3% | 0.7% | 1.5% |
| Men | 1.3% | 1.7% | 1.4% | 1.4% | |
| White | Women | 11.4% | 11.6% | 22.4% | 32.8% |
| Men | 73.7% | 72.3% | 54.0% | 32.0% | |
| Diverse Total | 26.3% | 27.7% | 46.0% | 68.0% | |
Data as of 12/31 of specified year | |||||
Hiring
In 2022, through strong outreach and recruiting efforts, we increased hiring among Hispanic/Latino men and Asian women. To improve diverse hiring across the board, among other things, we engage with external diverse organizations and undertake internal efforts, such as our Careers in Energy Diversity Student Conference.
| Race | Gender | 2021 (978 Total) | 2022 (1,700 Total) | Change from (2021-2022) |
|---|---|---|---|---|
| Asian | Women | 1.3% | 1.5% | +0.2 |
| Men | 3.6% | 1.5% | -1.8 | |
| Black | Women | 9.0% | 6.9% | -2.1 |
| Men | 12.2% | 11.1% | -1.1 | |
| Hispanic/Latino | Women | 2.6% | 2.1% | -0.5 |
| Men | 5.3% | 7.0% | +1.7 | |
| Other3 | Women | 1.9% | 1.2% | -0.7 |
| Men | 2.4% | 2.3% | -0.1 | |
| White | Women | 19.2% | 15.0% | -4.2 |
| Men | 42.5% | 51.1% | +8.6 | |
| Diverse Total | 57.5% | 48.9% | -8.6 | |
Data as of 1/1 – 12/31 of specified year | ||||
Promotions
We hire high-potential candidates and provide them with training and opportunity to experience different areas of the business and progress in their careers. As we continue to refine our approach to DE&I, we are exploring new ways to identify, develop, and improve the opportunity for diverse employees to be promoted. Some of the efforts include increased postings of manager and director roles, creating opportunities for greater exposure through rotations, and allocation of stretch assignments. In 2022, we increased promotions among White women, Black employees, and those employees who fall under the Other category.
| Race | Gender | 2021 (2,180 Total) | 2022 (3,094 Total) | Change from (2021-2022) |
|---|---|---|---|---|
| Asian | Women | 1.0% | 1.0% | 0.0 |
| Men | 1.3% | 1.0% | -0.3 | |
| Black | Women | 5.6% | 8.1% | +2.5 |
| Men | 7.4% | 9.2% | +1.8 | |
| Hispanic/Latino | Women | 1.5% | 1.2% | -0.5 |
| Men | 3.3% | 3.0% | -0.3 | |
| Other3 | Women | 0.7% | 0.8% | +0.1 |
| Men | 1.5% | 2.1% | +0.6 | |
| White | Women | 15.2% | 16.2% | +1.0 |
| Men | 62.3% | 57.4% | -4.9 | |
| Diverse Total | 37.7% | 42.6% | +4.9 | |
Data as of 1/1 – 12/31 of specified year | ||||
Separations11
The annual separation rate for Dominion Energy remains below the national and industry-sector averages. Consistent with workforce trends elsewhere, we saw an increase in separations from the company in 2022, particularly among Asian employees, Hispanic/Latino women, and women who fall under the Other category.
| Race | Gender | 2021 (948 Total) | 2022 (1,333 Total) | Change from (2021-2022) |
|---|---|---|---|---|
| Asian | Women | 6.8% | 9.8% | +3.0 |
| Men | 5.9% | 12.4% | +6.5 | |
| Black | Women | 8.1% | 8.8% | +0.7 |
| Men | 5.9% | 7.8% | +1.9 | |
| Hispanic/Latino | Women | 6.7% | 13.8% | +7.1 |
| Men | 7.2% | 8.1% | +0.9 | |
| Other3 | Women | 6.7% | 11.0% | +4.3 |
| Men | 7.0% | 7.8% | +0.8 | |
| White | Women | 6.6% | 8.6% | +2.0 |
| Men | 4.8% | 7.2% | +2.4 | |
| Diverse Total | 6.7% | 8.8% | +2.1 | |
Data as of 1/1 - 12/31 of specified year | ||||
Voluntary Resignations13
Voluntary resignations in 2022 increased overall, and increased among all demographic categories, consistent with broader economic trends. The largest increases in voluntary resignations occurred among Asian employees, Hispanic/Latino women, and women who fall under the Other category.
| Race | Gender | 2021 (487 Total) | 2022 (699 Total) | Change from (2021-2022) |
|---|---|---|---|---|
| Asian | Women | 6.1% | 9.1% | +3.0 |
| Men | 5.1% | 10.8% | +5.7 | |
| Black | Women | 4.8% | 5.2% | +0.4 |
| Men | 3.3% | 3.6% | +0.3 | |
| Hispanic/Latino | Women | 6.7% | 11.5% | +4.8 |
| Men | 5.1% | 6.1% | +1.0 | |
| Other3 | Women | 4.4% | 8.0% | +3.6 |
| Men | 3.3% | 4.3% | +1.0 | |
| White | Women | 3.5% | 4.8% | +1.3 |
| Men | 2.2% | 3.4% | +1.2 | |
| Diverse Total | 4.0% | 5.2% | +2.1 | |
| Total | 2.8% | 4.1% | +1.3 | |
Data as of 1/1 - 12/31 of specified year | ||||